How we told the story of our first year in numbers
To celebrate our first birthday, we built an interactive that tells our story so far with some remarkable numbers – like the fact that 30,638 comments were left on just one course discussion. Here, our Product Manager, Simon Pearson, shares some background to the project and how we developed it.
It all started with a simple question: “What if…?” Five minutes later, six of us were at a whiteboard scribbling down some of our key statistics. A little over an hour later, we had a working prototype that we showed to the whole company.
The idea for celebrating our first year was born out of one of our hack days, where everyone at FutureLearn puts down their tools for the day and joins cross-functional teams to share ideas and build new things together.
After the hack day, a close-knit team developed the project further. Lucy, our Creative Director, worked closely with Luke, our Copywriter, and James, one of our Front-end Developers, to create a delightful experience with an interaction pattern that, like the rest of FutureLearn, works well across device types. So how did we do it?
Defining the goals
While we already had the initial seed of the idea, in order to make that seed grow and bloom, we first needed to clearly define the goals of the project.
The original hack day idea was inspired by MailChimp’s annual reports. But rather than simply share our company stats (which works fine in the data-driven world of email marketing), we wanted to find a way to focus on what really matters to FutureLearn – the great slices of content that our partners create for our courses, and the discussions that this content inspires among our learners.
So we defined and stayed focused on our goals: to create something that our learners and partners might want to share; to celebrate our growth as a company; to build on our promise to be open with our data; and to say thank you to everyone who’s joined us on our journey so far.
Crafting the copy
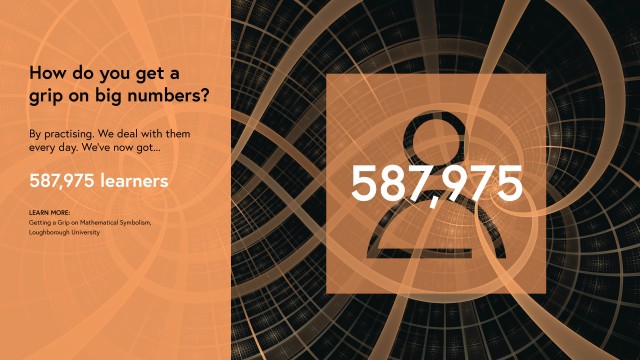
We began to explore the idea of introducing key questions, all pulled from our courses, and pairing these up with key stats from our first year.
For example, “What makes an ecosystem?” – a question posed by The Open University course “Introduction to Ecosystems” – was answered by “40 partners globally” – reflecting the fact that we can’t live without the universities and cultural institutions who’ve become our partners over the last 12 months.
We also wanted the story to reflect the FutureLearn brand, and the conversational, thought-provoking and slightly irreverent tone of voice that’s developed over the last year. So Luke crafted the copy until everyone agreed that it felt just right for FutureLearn.
Designing the visuals
Lucy explored a number of different visual executions of these ideas, playing around with which components would be fixed on the page and which would scroll. Here are a few of those designs.
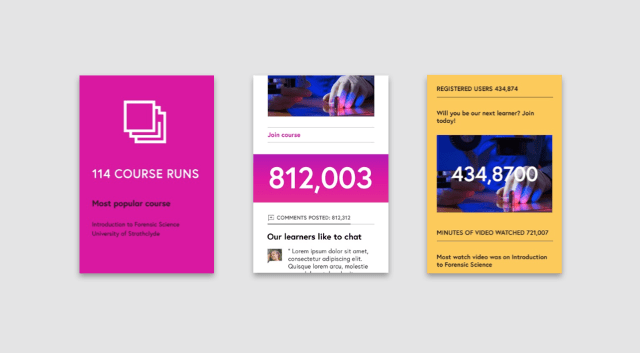
Some of the initial designs were quickly ruled out as they wouldn’t have been as effective on mobile or tablet, which is very important to us at FutureLearn. Other designs seemed to be too wordy or complex. We found that if there was too much copy, when you interacted with the scrolling of the page, you were inclined not to read anything at all, but just watch the numbers scroll. Finding the sweet spot between usability and visual intrigue was the real challenge.
Building the interactive
Once we’d decided on the design approach for the interactive, we built a simple prototype, which was then finessed over the following weeks into the end product you see now. Building something that worked well on desktop and mobile devices was a particular challenge.
For mobile phones and smaller tablets, we settled on dropping the large background images and scrolling numbers, and making the key questions and stats the focus. The background images are post loaded, so are only included if we’re on a device that is capable of displaying them (so we’re not using bandwidth and memory unnecessarily).
Optimising the images was a delicate balancing act, as we wanted them to be rich and visually interesting, but we had to be careful not to make the interactive too resource intensive and keep its payload relatively small. As we tested the interactive on more devices we quickly discovered that what works well on a desktop browser doesn’t necessarily work on a more resource constrained device such as an iPad.
Like the main FutureLearn site, we’ve strived to ensure that the interactive is as accessible as possible, so that the core content is available to everyone, no matter how they access it.
We’re proud of what we’ve achieved at FutureLearn in our first year. And we look forward to reflecting on our future years too!